--> in Deutsch
The Sleep observation
Public self knowledge on sleep (Festenberg, N. v. ;Journ. of Selfev., Feb. 2001, 14, p. 33, New Jersey )
1. Introduction
It would be interesting to know the relationship of sleep habits and duration of daylight.
You diligently would have to write down your times of going to bed and getting up, ideally
with a subjective evaluation of the daily level of vigilance.
In the dark period this requires a lot of discipline. I'd suppose even so much that
the whole person would be demanded. One would have to suffer from the torments of coercive
detention's hell. You would always end up with the same clockwork-like and extremely boring
sleeping habits, completely independent on any external parameters. And one night of observation
would be well enough. A longer period wouldn't increase the reliability of the data.
This method is therefore of no use.
All different in Central Europe instead.
In spring 2001 we we're able to collect a continuous time series of 60 days.
The objective was to detect phases of hyperactivity in order to determine characteristic markers for later predictability.
2.
Materials and methods
The methods had to match the primitive lay-out of a sleeping place. Common sleep-data logger were not available within reasonable demand.
After some dimensional analysis a book, a pencil and a
very precise (seconds) watch were chosen as tools. The book served as portable data bank, the
pen as data logger. The watch required some experience in usage. In the end the direct
optical reading was given preference, despite the danger of changing numbers.
On the so-called Wecker-days (Wecker, der: german for alarm clock) the morning time
could be determined very precisely. On the so-called Loisir-days the continous process of awakening needed to be discretized.
The base-value was the impact of the first morning-urin drops on the WC-porcelaine.
This time minus five minutes was considered as morning value.
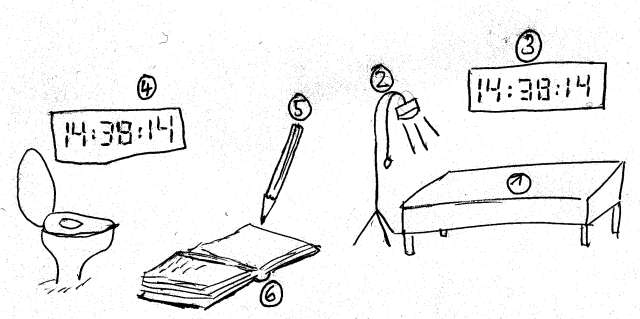
Fig. 1 : experiment's lay-out: 1 sleeping place, 2 standard lamp, 3 very precise watch synchronized with 4, as well a very precise watch, 5 portable pencil, 6 data bench (book), also portable
As it's generally a loisir-process when you fall
asleep a special algorithm had to be applied.
Testler (1998) proposed a method that recently
is referred to as Testler'ian lamp calculation: as short as possible before the light goes out, the
time is read. Then a personal constant is added (typically and sufficiently precise 10.0 min, also assumed
in this work). The result of this calculation is quickly written down in the data bank. In ideal cases the
light vanishes directly so that you can fall a sleep according to your personal sleeping constant.
Figure 1 shows the experiment's lay.out.
3. Results
Figure 2 shows the measured values for state-of-mind phase transitions.
For the sake of clarity bed-times after midnight are depicted as times larger than 24.
The mean get-up time was 8:43 a.m., at 1:22 a.m. it was most probable to go to bed.
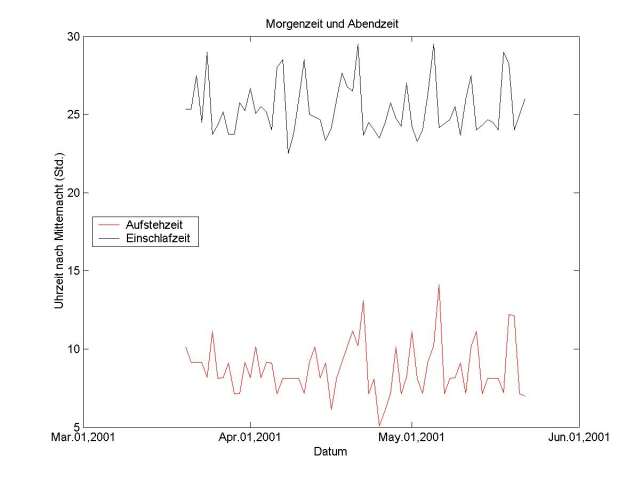
Figure 2: times of phase transition
Figrue 3 shows the difference between morninig and evening time, equivalent to the
length of the day. Furthermore 7- and 30-day- running mean are depicted. The average waking
period reads 16 hours and 39 minutes, with a standard deviation equal to 2:23 h.
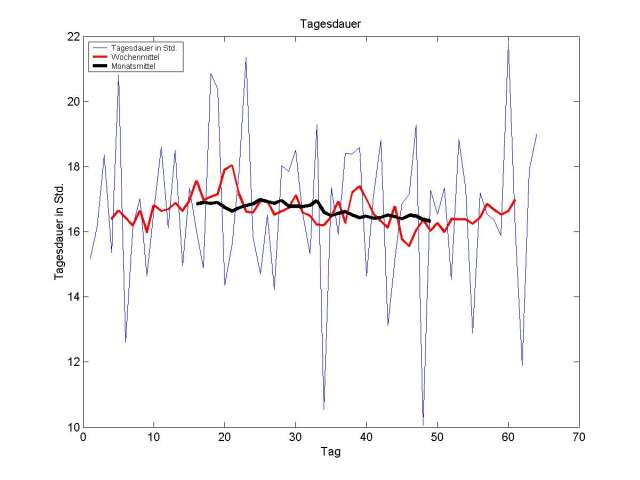
Figure 3: length of the days
4.
Discussion
With a first view the big variations of the length of days are remarkable. A standard deviation
of almost two and a half hours reveals the student's life as unsteady.
In connection with the absolute time you can even
prove statistical convenience and spontaneousity of late bed-times.
Get-up and falling-asleep times of one day are virtually not related at all: the correlation coefficient
reads small 0.036. If you compare the get-up time with the bed-time of the
day before the calculation of the correlation coefficient yields handsome 0.79.
It was a mathematical hope of this work to detect discrete maxima in the frequency-space of the day-lengths.
(Fig.4). Unluckily, no clearly preferred peaks show up.
A week 7 day rythm (frequency equal to 0.28) might be present
as well as a quite bold ca. 4-day rythm (f=0.45).
But it's apparently not possible to obtain significant results.
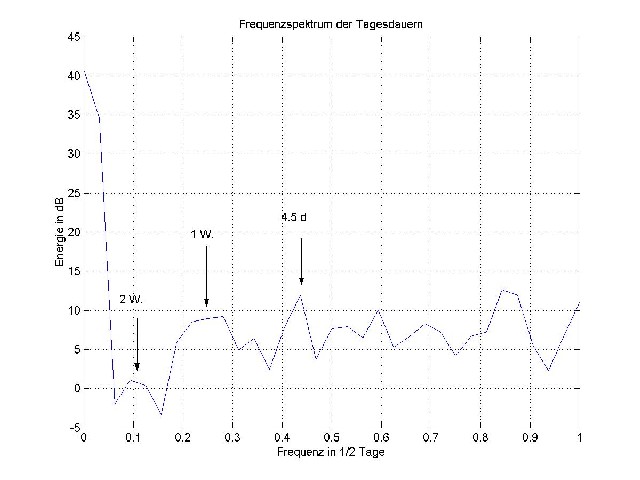
Figure 4: frequencies in the day-lengths
(in 0.5/days)
The 7-day running mea (Fig. 3) might optically propose a weak 2-months oscillation.
The 30-day mean apparently contains a slight downwards-trend. Perhaps it's the beginning easiness of summer.
After all the author considers the mean day-lenght
of 16:39 hours (the daily sleep dose of 7:21 h respectively) as main result.
5. Prospect
The results are promising and it can be recommended to spend more money and
effort on research in this domain.
stecken. Specifically a generalized formalism to handle loisir-processes would be desirable
6. Literature
- Testler, E., Journ.
o. Be,, Empirical Methods on Loisir processes, 23
,S.33, 1994, Little Rock
- Ronald, I, Sle.
Rev., Measurements on
sleeping organisms, 51, S. 69, 1981, New Jersey
- Shamilanov, V.,
Jour.o. Be., Considerations on Sleep, 62, S.2310, 1976, Little Rock-